Hello everyone. First of all I would like to wish you all a happy new year! Things haven’t changed much regarding the pandemic, but let’s hope for this summer we can go back to all the normal things we do in vacations. In this post I am going to introduce a new metric that is usually measured with ECGI: The Dominant frequency (or DF from now on). I haven’t work yet on this parameter, but I think it is a good thing to talk about in order to understand why ECGI is a promising technology for AF diagnosis and treatment.
In the last post I talked about rotors. I explained that they are reentrant patterns in the electrical activation of the heart, and how these reentries are one of the main mechanism that might sustain an AF episode. I also introduced a way to identify rotors which consisted in identifying singularities on phase maps. One of the main challenges of the rotor analysis is to come up with an standardized methodology to identify these phase singularities and analyze their temporal stability. Dominant frequency may be a an alternative approach to solve these issues as well as a source of information for other AF drivers.
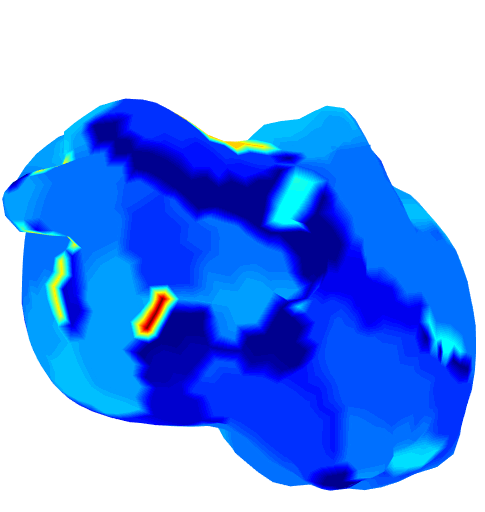
DF is defined as the frequency of electrogram’s sinusoidal component with highest magnitude. The different sinusoidal components of electrograms are obtained by transforming these signals to the frequency domain. DF values are then calculated in different regions of the atrium. The result is, as always, a beautiful map which represent the distribution of the excitation frequencies along the atria. According to the observations, the region with highest DF is quite likely to be the one driving the arrythmia[1]. A possible explanation for these observations is the presence of ectopic foci in the atrium firing, and stimulating their surrounding tissue. This is why we usually look for the region with the Highest Dominant Frequency (or just HDF) in the DF maps.