Going around after rotors
After the first Summer School of the consortium, I had the chance to start developing my own algorithms.
The last week of October and first 2 of November were quite busy due to the organization of the first Summer School of the consortium. Although intense and compact, we received there very nice and interesting contents that hopefully will be very useful for our projects. But the best part of this event was not the content itself, but the opportunity to get deeper into the consortium, understanding how all our projects fit together, getting to know better the people involved, and feeling a little bit more part of the PersonalizeAF community. Unfortunately, COVID-19 forced us to do this training online. It would have been nice to receive all my ESR mates here in Valencia. Well, I guess we will have to wait to 2021 for that guys. Anyway, after the training I also had the chance to get my hands into what I really like: programming algorithms. In this case I have been trying to detect reentrant patterns in simulated ECGI data. More details about this right below!
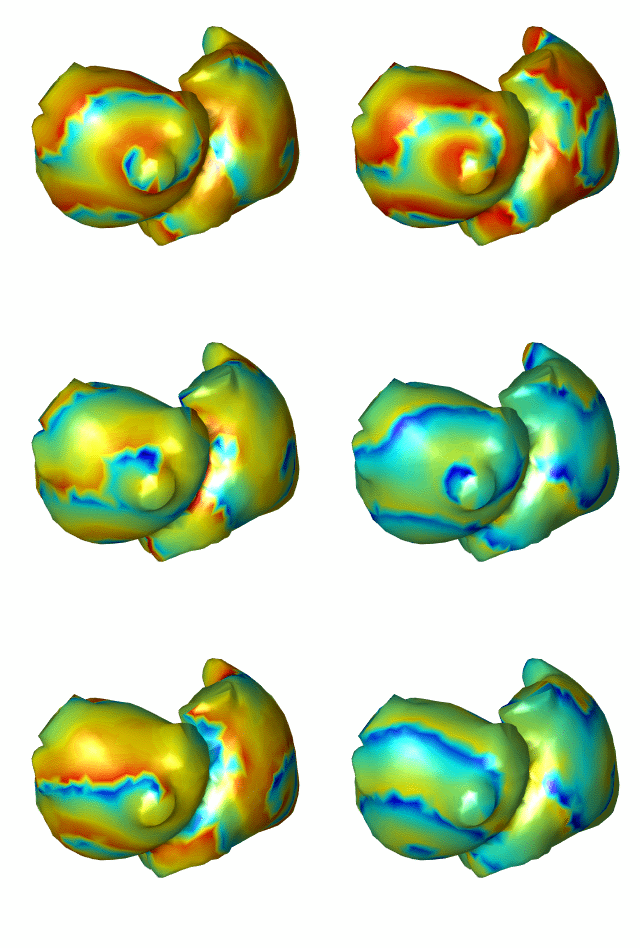
The first thing to know about this topic is why are we even looking for reentrant patterns in the electrical propagation of the atria. Do you remember in the last post (surely not), when I mentioned that AF could be produced and maintained by well localized phenomena? Well, reentrant patterns is one of these. In case of reentry, the electrical activity turns around a certain point (that may be static or not) perpetuating the electrical excitation of the tissue around it. Please check the animation below to have a clearer idea of how these rotational patterns look like. In this illustration, simulated data of extracellular voltages are represented in a 3D model of the atrium. This kind of data is very useful for me in this initial stage to develop new algorithms for rotor identification. But first let’s introduce what do I mean by rotors and why they are important.

Rotors (or functional reentries) are a specific type of reentrant pattern which are not necessarily produced by any anatomical structure interfering in the electrical propagation, but by heterogeneities in the conduction properties of the tissue. These changes in the electrical conduction properties of the atria are usually the result of the natural evolution of the disease. The reasons why tissue’s electrical properties degenerate in AF patients are still unknown, and it is quite complicated to determine what regions of tissue are getting affected or to stablish a link between these alterations and the final electrical propagation in the patient. This bassically
means that rotors, which are mechanism that alter the normal electrical propagation, can take place anywhere in the atria and not just in the classical places where cardiologist perform ablation. A possible explanation of why the success rate of this kind of interventions is so low, is indeed the presence of reentrant patterns, like rotors, that are not well isolated using traditional ablation strategies. In order to help cardiologists during ablation, we are using ECGI data to identify and characterize possible rotors. In this way, we intend to determine whether they are responsible of the arrhythmia, and if so, suggest new and personalized ablation sites.
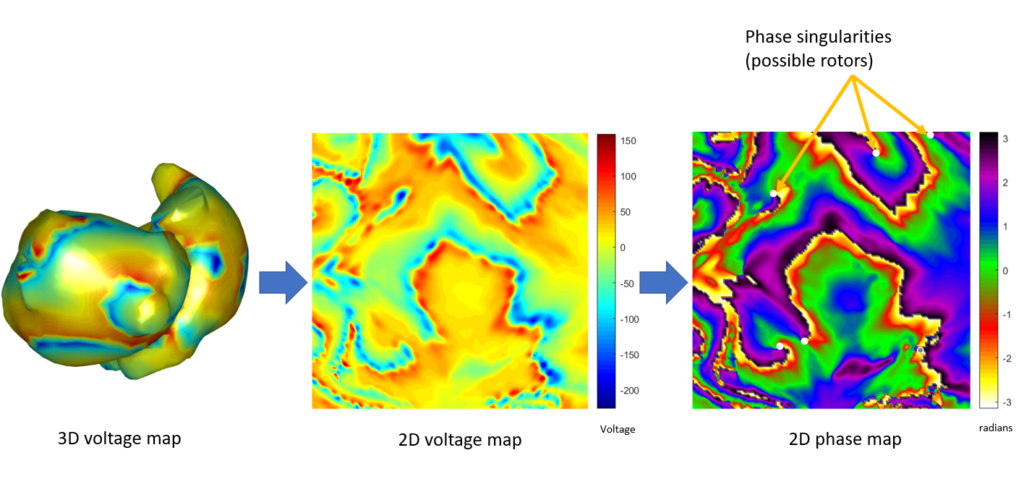
Regarding my progress in this difficult task, so far I have managed to transform 3 dimensional map representations (like the one shown above) into images. The main reason for doing so is that, using images we have available tones of well known and optimized image processing algorithms that can help us to identify rotors. Besides, once the 3D to 2D transformation is known, going from 3D maps to images and vice versa is fast and trivial. I have already implemented an algorithm that is able to find rotors on these images using phase maps. These are an alternative representation of the voltage maps in time domain, that encode the stage of the electrical cycle using angles. I know it is confusing, but it is very handy if you want to localize rotational patterns around a point. I will leave it here before getting to boring, and giving you a nice image that describes (to some extend) the process. The next step will be to improve the rotor tracking along time and compare the obtained results with the algorithm already available in the lab (those I am trying to improve).

