Hello everyone! I hope you all are okay in this convulsive times. I must say that I am quite optimistic about making through this pandemic soon with all these new vaccination campaigns running in Europe. So hold on mates! The end is near. I am also quite glad to see that my ESR peers are making much progress on their respective projects. In this post I am talking about my progress on the rotor detection algorithm I introduced in this post.
In the last month I ultimated the last details of the algorithm itself and I started to focused on the parameter study. As many other algorithms, this one contains a set of parameters that must be optimized to get a good performance. In my case, I chose to reduce as much as possible the number of parameters to be optimized by stablishing some reasonable assumptions. In this way I could make the algorithm’s behavior more understandable and based the optimization on theoretical bases.
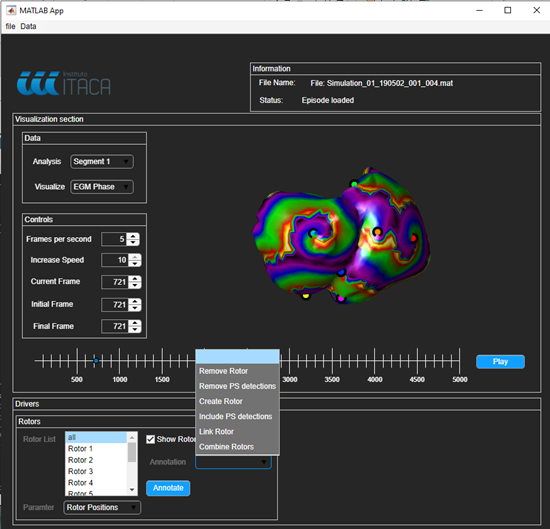
In order to assess the performance of the algorithm for the different parameters combinations, I had first to arrange a dataset with known rotor locations. Initially, this dataset included only simulations but right now I am starting to test the algorithm on patient data too. You can imagine that labelling AF simulations looking for rotors must be an exhausting task, and it is. But I could fulfilled it making use of my new app: The rotor Inspector. I include below a screenshot of the interface. There you can check that I am not an expert on making apps in MATLAB, but still it was fun to code and it made the work much easier.