Navigating through the heart chambers

Obtaining images and functional information from within the heart

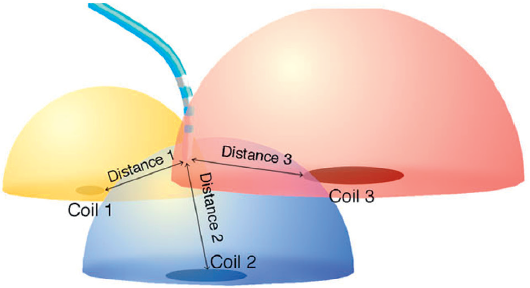
In the previous post I explained how in the Kick-Off meeting of the consortium we had the opportunity to  discuss our projects and what we would like to work on, apart from the networking we could do online and the courses we attended. Today I would like to talk about how I am going to develop the project, and for that I will explain how one of the tools I will use to obtain data works. This tool is the electroanatomic map, obtained with navigation systems. 

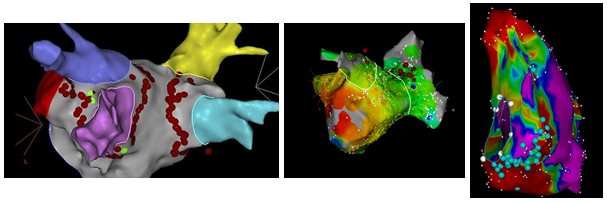
To begin with, let’s talk about what kind of data we get from these systems. The most simple data we get is the anatomical information of the structure that is mapped. These kinds of details are useful for electrophysiologists in order to position themselves during the surgical procedure, but not only that, it also helps in grasping the intervariability between patients when it comes to structural information. In addition to this, it is also useful for some treatments of a few kinds of arrhythmias, and one example is the treatment of pulmonary vein isolation (PVI) in atrial fibrillation.  

Another type of information we get from these navigation systems is voltage information of the tissue that is mapped. This voltage data is useful in order to obtain functional information about the tissue. It has been seen how high voltage areas are related to healthy tissue, whereas low voltage areas are related to fibrotic tissue, scars from myocardial infarctions, dysplasias… unhealthy tissue in general. Due to that, areas of low voltage and their surroundings are sometimes burnt in order to treat some types of arrhythmias. 

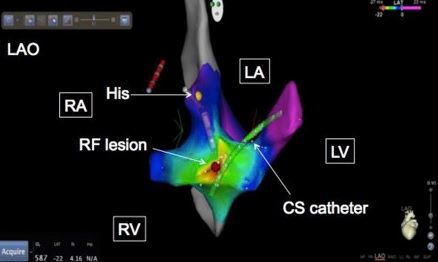
Last but not least, another tool that we use in these navigation systems is the activation mapping. In this case, the information we get is related to time and the transmission of the wavefront through the tissue. This kind of information allows us to see how the signal is transmitted, and understand how this transmission is affected by possible circuit reentries or areas of slow conduction of the impulse. Depending on the type of arrhythmia that is being treated, it is important to localise and burn these areas of affected wavefront transmission.  

In the figure below you can see an example of these three maps and how they are visually.

From left to right: anatomical map, activation map and voltage map

Now we know what kind of information we get from these electroanatomical maps, but how do the navigation systems obtain this information? How do they position catheters into space to obtain information from them? There are currently three different navigation systems, and each of them work a bit differently: CARTO-3, from Biosense Webster; EnSite NavX, from St. Jude Medical; and Rhtyhmia, from Boston Scientific. However, the main information collection system is based on the combination of magnetic and electrical data.

To begin with the positioning of the catheters, low magnetic fields are created with three coils, generating a triangulation system similar to the one used in GPS systems. This magnetic field information will be sensed by catheters with magnetic sensors. These catheters will detect the strength of each of the magnetic fields created by these 3 coils, and will calculate the distance to each of the coils depending on the intensity of each field sensed at the catheter. This can be more easily understood with the figure on the right.

Positioning system of the catheter based on the distance calculation to the coils that generate magnetic fields [1]


To more easily differentiate and position the different catheters and their electrodes, this magnetic positioning is mixed with an electric field disturbance information. This electric field is created by patches on the back and the front of the patient’s thorax. Then, each catheter sends a current at a certain frequency, and the strength of the current emitted is measured at each of the patches that create an electric field. With this information, we obtain a current ratio which is unique for each catheter, hence we can differentiate each catheter. With this, it is possible to locate the catheters and the information they give us. With respect to the substrate information (voltage and activation data), it is basically collected with the electrodes of the catheters when getting into contact with the walls of the heart chambers. In the areas not touched by the catheters, this substrate information is interpolated. 

Catheter localisation in the right atrium [2]

Hopefully, after this post you have a bit clearer what we do with electroanatomical mapping and how we get the data that we analyse and compare with other tools, such as fibrosis information from MRI or conduction velocity from ECGi. In the next posts I will try to explain how we analyse and compare the data obtained from the tool explained today, so stay tuned! 

Eric

References:

[1] Issa, Ziad F., John Michael Miller and Douglas P. Zipes. Clinical arrhythmiology and electrophysiology: a companion to Braunwald’s heart disease. Elsevier Health Sciences, 2009. 

[2] Jefferies, J. L., Blaxall, B., Towbin, J. and Robbins, J. Cardioskeletal Myopathies in Children and Young Adults. Academic Press, 2016.


If you want to join me and the rest of the network in our journey, don’t forget to follow us in our social media using the hashtag #PersonalizeAF!